Showing posts with label Spectroscopy. Show all posts

28 Feb 2012

The Measurement of Tryptophan Content by Using UV-Spectrometer


The absorption of protein solutions in the UV is the result of tryptophan and tyrosine (and to a very minor, and negligible, extent phenylalanine and cysteine). The absorption maximum will depend on the pH of the solution, and spectrophotometric measurements are usually made in alkaline solutions. Absorption curves for tryptophan and tyrosine show that at the points of intersection, 257 and 294 nm, the extinction values are proportional to the total tryptophan + tyrosine content. Measurements are normally made at 294.4 nm, since this is close to the maximum in the tyrosine curve, and in conjunction with the extinction at 280 nm, the concentrations of each of the two amino acids may be calculated. This is the method of Goodwin and Morton.
Earlier portion tryptophan content you have to prior hydrolyze the protein sample, see the method in my previous posting.

Now is the method of the measurement of Tryptophan content:

The protein sample is made 0.1M in NaOH.

    Absorption by most proteins in 0.1M NaOH solution decreases at longer wavelengths into the region 330--450 nm, where tyrosine and tryptophan do not absorb. Suitable blanks for 294 and 280 nm are therefore obtained by measuring extinctions at 320 and 360 nm and extrapolating back to 294 and 280 nm.
Measure the absorbance at 294.4 and 280 nm in cuvets (transparent to this wavelength, i.E., quartz) in a spectrometer.

The amount of tryptophan (w) is estimated from the relative absorbances at these wavelengths
By the method of Goodwin and Morton (2) shown in Equation below:

    E280 = w Ew + (x-w)Ey

    Therefore:

    W = (E280 - x Ey) / (Ew -Ey)

Where x = total mol/L, w = tryptophan mol/L, and (x- w) = tyrosine mol/L, Ey = Molar extinction of tyrosine in 0.1M alkali at 280 nm= 1576. Ew = Molar extinction of tryptophan in 0.1M alkali at 280 nm = 5225.

Also, x is measured from E294.4 (the molar extinction at this wavelength). This is 2375 for both Tyr and Trp (since their absorption curves intersect at this wavelength). An accurate reading of absorbance at one other wavelength is then sufficient to determine the relative amounts of these amino acids.
An alternative method of obtaining the ratios of Tyr and Trp is to use the formulae derived by Beaven and Holiday.

    MTyr = (0.592 K294- 0.263 K280) / 1000

    MTrp = (0.263 K280 - 0.170 K294) / 1000

Where MTy r and MTrp are the moles of tyrosine and tryptophan in 1 g of protein, and K294 and K280 are the extinction coefficients of the protein in 0.1M alkali at 294 and 280 nm. Extinction values can be substituted for the K values to give the molar ratio of tyrosine to tryptophan according to the formula below:

    MTyr / MTrp = (0.592 E294 - 0.263 E280 / 0.263 E280 - 0.170 E294)


In this analysis, the tyrosine estimate may be high and that of tryptophan low. If amino acid analysis indicates absence of tyrosine, tryptophan is more accurately determined at its maximum, 280.5 nm.


Reference:
    Prieto, L.M. et al., “The production of rhamnolipid by a Pseudomonas aeruginosa strain isolated from a southern coastal zone in Brazil”, Chemosphere (2008), doi:10.1016/j.chemosphere.2008.01.003.
    Burden, D.W.; Whitney, D.B., "Biotechnology, Proteins to PCR, A Course in Strategies and Lab techniques", Birkhauser Boston, 1995.
    Thaniyavarn, J. et al., "Production and Characterization of Biosurfactants from Bacillus licheniformis F2.2" , Biosci. Biotechnol. Biochem., 67 (6), 1239-1244, 2003
    Eeles, R.A.; Stamps, A.C., "Polymerase Chain Reaction (PCR) The Technique And Its Applications", The Institute of Cancer Research, The Royal Marsden Hospital, Sutton, Surrey, United Kingdom, 1993.
    Aitken, A.; Learmonth, M., "The Protein Protocols Handbook, Second Edition: Protein Determination by UV Absorption", Humana Press, 2002.
    Aitken, A.; Learmonth, M., "The Protein Protocols Handbook, Second Edition: Quantitation of Tryptophan in Proteins ", Humana Press, 2002.
    Heptinstall. J and Rapley. R, “The Nucleic Acid Protocols Handbook: Spectrophotometric Analysis of Nucleic Acids”, Humana Press, 2000.
    Walker, J.M., "The Protein Protocols Handbook, Second Edition: The Bicinchoninic Acid (BCA) Assay for Protein Quantitation", Humana Press, 2002.
    Waterborg, J.H., "The Protein Protocols Handbook, Second Edition: The Lowry Method for Protein Quantitation", Humana Press, 2002.
    Kruger, N.J., "The Protein Protocols Handbook, Second Edition: The Bradford Method for Protein Quantitation", Humana Press, 2002.
    Kolmodin, L. A, Williams, J.F, “The Nucleic Acid Protocols Handbook: Polymerase Chain Reaction, Basic Principles and Routine Practice”, Humana Press Inc., Totowa, NJ, 2000.
    Chachaty. E, Saulnier. P, “The Nucleic Acid Protocol Handbook: Bacterial DNA Extraction for Polymerase Chain Reaction and Pulsed-Field Gel Electrophoresis”, Humana Press Inc., Totowa, NJ, 2000.
    Williams. D. R, Rapley. R, “The Nucleic Acid Protocol Handbook: Agarose Gel Electrophoresis of Nucleic Acids”, Humana Press Inc., Totowa, NJ, 2000.
    Smith. D. R, “The Nucleic Acid Protocol Handbook: Restriction Endonuclease Digestion of DNA”, Humana Press Inc., Totowa, NJ, 2000.
    Stewart, T.L., Mann, V., “Methods in Molecular Medicine, Vol. 80: Bone Research Protocols”, Humana Press Inc., Totowa, NJ, 2003.
    Theophilus, B. D. M., “Methods in Molecular Biology, Vol. 86: RNA Isolation and Characterization Protocols”, Humana Press Inc., Totowa, NJ, 1998.
    Perry, J., Parniske, M., "Lotus japonicus Handbook: 96-WELL DNA ISOLATION METHOD", 2005 Springer.
    Winstanley, C., Rapley, R., “The Nucleic Acid Protocols Handbook: Extraction and Purification of Plasmid DNA”, Humana Press Inc., Totowa, NJ, 2000.
    Bogner, P., Killeen, A. A., “Molecular Diagnostics: For the Clinical Laboratorian, Second Edition: Extraction of Nucleic Acids”, Humana Press Inc., Totowa, NJ, 2005.
    Harwood. A. J, “The Nucleic Acid Protocol Handbook: Native Polyacrylamide Gel Electrophoresis”, Humana Press Inc., Totowa, NJ, 2000.
    Aitken. A, Learmonth. M, “The Protein Protocols Handbook, Second Edition: Estimation of Disulfide Bonds Using EIIman's Reagent”, Humana Press Inc., Totowa, NJ, 2002.
    Miller. R. M, Zhang. Y, “Methods in Biotechnology, Vol 2 Bioremediation Protocols: Measurement of Biosurfactant-Enhanced Solubilization and Biodegradation of Hydrocarbons”, Humana Press Inc., Totowa, NJ, 1997.
    Boerner. S. A, Lee. Y. K, Kaufmann. S. H, Bible. K. C., “The Protein Protocols Handbook, Second Edition: The Nitric Acid Method for Protein Estimation in Biological Samples", Humana Press, 2002.


See more: Biotechnology

16 May 2011

Fluorescence Spectroscopy


THEORETICAL CONSIDERATION
1. Molecular fluorescence is the optical emanation from molecules with the intention of be inflicted with been excited to privileged energy levels by captivation of electromagnetic radiation.
2.The foremost benefit of fluorescence detection compared to captivation measurements is the greater sensitivity
Achievable since the fluorescence indicate has in opinion a zip background.
3. Analytical applications include a) quantitative measurements of molecules in solution and 2) fluorescence Detection in liquid chromatography.
Transitions linking molecular electronic energy levels:

Instrumentation
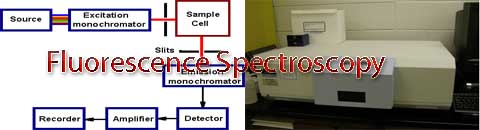
A predictable fluorimeter contains an excitation source, sample cell, fluorescence detector.
Molecules in solution are ordinarily excited by uv light and the excitation source is ordinarily a deuterium or xenon lamp. Broad-band excitation light from a lamp passes through a monochromator, which passes single a selected wavelength. The fluorescence is single by a further monochromator and detected by a photomultiplier tube. Scanning the excitation monochromator gives the excitation spectrum and scanning the fluorescence monochromator gives the fluorescence spectrum. Simple instruments now and again aid single a bandpass filter to excellent the excitation wavelength.

fluorometer schematic


Single-molecule fluorescence spectroscopy in (bio)catalysis


IV. Instrumentation


A. Basics of the Instrumentation
Introduction
A spectrometer is an optical logic with the intention of transmits a point belt of electromagnetic spectrum. Dispersion of uncommon wavelengths is accomplished with the separating capability of refraction (prism) or diffraction (diffraction grating). Typical applications are isolation of a narrow belt of radiation from a continuum light source pro captivation measurements, or  analysis of the emanation from excited atoms or molecules.
Instrumentation
The UV-Vis spectral range is approximately 190 to 900 nm, as defined by the working range of predictable money-making UV-Vis spectrophotometers. The short-wavelength limit pro unadorned UV-Vis spectrometers is the captivation of ultraviolet wavelengths a reduced amount of than 180 nm by atmospheric gases. Purging a spectrometer with nitrogen chatter extends this limit to 175 nm. Working further than 175 nm requires a vacuum spectrometer and a apposite UV light source. The long-wavelength limit is ordinarily single-minded by the wavelength response of the detector in the spectrometer. High-end money-making UV-Vis spectrophotometers proffer the appreciable spectral range into the NIR region as far as 3300 nm.
Spectrometer designs and optical components are optimized to snub stray light, which is lone of the limiting factors in quantitative absorbance measurements. The detector in single-detector instruments is a photodiode, phototube, or photomultiplier tube (PMT).
1. Light Source
The light source is ordinarily a deuterium discharge lamp pro UV measurements and a tungsten-halogen lamp pro visible and NIR measurements. The instruments involuntarily swap lamps as scanning linking the UV and visible regions. The wavelengths of these unremitting light sources are typically single by a holographic grating in a single or dual monochromator or spectrograph. The spectral bandpass is at that time single-minded by the monochromator gash width.
2. Monochromator
A predictable monochromator design is publicized not more than. It consists of the diffraction grating (dispersing element), slits, and round mirrors.
Schematic of a Czerny-Turner monochromator
Scanning is accomplished by rotating the grating.

Monochromator parameters
Bandpass - The wavelength range with the intention of the monochromator transmits.
Dispersion - The wavelength dispersing power, ordinarily agreed as spectral range / gash width (nm/mm). Dispersion depends on the crucial part, grating resolving power, and the grating order.
Resolution - The smallest bandpass of the spectrometer, ordinarily single-minded by the aberrations of the optical logic.
Acceptance slant - A rate of light collecting skill, crucial part / mirror diameter

3. Sample
     Solute
    Solvent
Care and Handling of Cuvettes

The style in which cuvettes are handled is exceptionally valuable. Frequently, two cuvettes are used interchangeably, lone pro the "blank" and lone pro the samples being analyzed. Any alteration in the cuvettes, such as thickness of the schooner, or approximately flaw, tinge, smudge or scrape in the schooner, will cause unreliable results. It is therefore, essential to be very precise as using cuvettes and permanently stay on these rules.
1.Avoid usage the decrease part of the cuvette (this is everywhere the light will pass through).
2.Always sponge down the cuvette with a link of portions of the then sample you are difficult previous to you take a measurement.
3.Wipe rancid the outside of the cuvette with a Kimwipe to remove liquid or fingerprint smudges previous to you place it in the sample holder. Never wipe with one other kind of towel or cloth.
4.Befall precise to permanently line up the cuvette in the sample holder the same way each calculate.  The small plastic cuvettes with the intention of are used with the UV-VIS be inflicted with a small pointer on lone feature. That feature must be deposit in the holder facing to the missing.
5.Befall guaranteed to aid the same type of cuvette in the Spectrophotometer  pro the bemused and the samples you are analyzing when doable. The UV-VIS we be inflicted with is dual-beam, so it is very valuable to aid a "matched pair" of cuvettes. If a purchased "matched pair" of cuvettes is not unfilled, at that time excellent a cuvette to be used single pro the bemused and a further to be used single pro the samples.
It cannot be stressed too highly with the intention of the higher than rules should permanently be followed when you are using one kind of visible or ultraviolet spectrophotometer. Sloppy practice is indefensible.

4. Photomultiplier Tube (PMT)
Introduction
Photomultiplier tubes (PMTs) convert photons to an electrical indicate. They be inflicted with a distinguished domestic advance and are insightful detectors pro low-intensity applications such as fluorescence spectroscopy.
Design
A PMT consists of a photocathode and a run of dynodes in an evacuated schooner enclosed space. When a photon of sufficient energy strikes the photocathode, it ejects a photoelectron due to the photoelectric effect. The photocathode material is ordinarily a mixture of alkali metals, which get on to the PMT insightful to photons right through the visible region of the electromagnetic spectrum. The photocathode is by a distinguished unenthusiastic voltage, typically -500 to -1500 volts. The photoelectron is accelerated towards a run of bonus electrodes called dynodes. These electrodes are all maintained by successively a reduced amount of unenthusiastic potentials. Additional electrons are generated by all dynode. This cascading effect creates 105 to 107 electrons pro all photoelectron with the intention of is expelled from the photocathode. The amplification depends on the digit of dynodes and the accelerating voltage. This enlarged electrical indicate is collected by an anode by ground the makings, which can be measured.
Phototubes are akin to PMTs, but consist of single a photocathode and anode. Since phototubes sort out not be inflicted with a dynode string to provide domestic amplification, they are used in a reduced amount of insightful applications such as captivation spectrometers.
Schematic of a PMT

Typical specifications
Wavelength range:1
110-1100 nm
Quantum efficiency (Q.E.):2
1-10%
Response calculate:
1-20 ns
1 Wavelength sensitivity depends on wavelength. UV-sensitive PMTs should be inflicted with
UV-transmitting windows, think it over optical equipment.
2 The Q.E. Is the (number of electrons expelled by the photocathode / digit of thing photons).
5. Types of Spectrophotometers
Most money-making UV-Vis captivation spectrometers aid lone of three overall optical designs: A fixed or scanning spectrometer with a single light beam and sample holder, a scanning spectrometer with dual light beams and dual sample holders pro simultaneous measurement of P and Po, or a non-scanning spectrometer with an array detector pro simultaneous measurement of multiple wavelengths. Inside single-beam and dual-beam spectrometers, the light from a lamp is single previous to success the sample cell. Inside an array-detector instrument, all wavelengths pass through the sample and the dispersing element is linking the sample and the array detector.

Single Beam Spectrophotometer

Split Beam Spectrophotometer


Double Beam Spectrophotometer


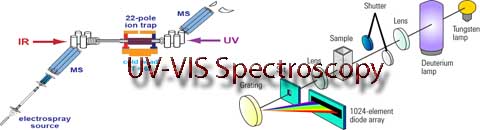
UV-VIS Spectroscopy


I. Introduction

Electromagnetic Spectrum
For convenience in talking about electromagnetic radiation, we classify photons of different energies into different spectral regions. The photons in all of these regions have the same electromagnetic nature, but because of their very different energies they interact with matter very differently. For example, the human eye can only detect radiation that is in the visible region of the spectrum (hence the name). These photons are both transmitted by the lens of the human eye and absorbed by the photoreceptors in the retina. There is no fundamental difference in the nature of electromagnetic radiation of 350 nm versus 400 nm, other than our eyes can sense the 400-nm photons directly. A 350-nm photon is in the ultraviolet portion of the electromagnetic spectrum. Some of the boundaries between spectral regions are not well-defined as between ultraviolet and visible radiation.

Visible Spectrum
The visible region of the electromagnetic spectrum consists of photons with wavelengths from approximately 400 to 700 nm. The short wavelength cutoff is due to absorption by the lens of the eye and the long wavelength cutoff is due to the decrease in sensitivity of the photoreceptors in the retina for longer wavelengths. Light at wavelengths longer than 700 nm can be seen if the light source is intense.

II. UV-VIS Spectroscopy
Ultraviolet and visible (UV-Vis) absorption spectroscopy is the measurement of the attenuation of a beam of light after it passes through a sample or after reflection from a sample surface. Absorption measurements can be at a single wavelength or over an extended spectral range. Ultraviolet and visible light are energetic enough to promote outer electrons to higher energy levels, and UV-Vis spectroscopy is usually applied to molecules or inorganic complexes in solution. The UV-Vis spectra have broad features that are of limited use for sample identification but are very useful for quantitative measurements. The concentration of an analyte in solution can be determined by measuring the absorbance at some wavelength and applying the Beer-Lambert Law.
Since the UV-Vis range spans the range of human visual acuity of approximately 400 - 750 nm, UV-Vis spectroscopy is useful to characterize the absorption, transmission, and reflectivity of a variety of technologically important materials, such as pigments, coatings, windows, and filters. This more qualitative application usually requires recording at least a portion of the UV-Vis spectrum for characterization of the optical or electronic properties of materials.

Absorption Spectra

Identification of molecules using absorbance spectra

Measurement at a fixed Wavelength


III. Beer-Lambert Relationship

The ultraviolet spectra of compounds are usually obtained by passing light of a given wavelength (monochromatic light) through a dilute solution of the substance in a non-absorbing solvent.
The intensity of the absorption band is measured by the percent of the incident light that passes through the sample:
% Transmittance = (I / I0) * 100%
Where:
I = intensity of transmitted light
I0 = intensity of incident light
Because light absorption is a function of the concentration of the absorbing molecules, a more precise way of reporting intensity of absorption is by use of the Beer-Lambert Relationship:
Absorbance = -log(I / I0) = ecl
Where:
E = molar absorptivity
C = molar concentration of solute
L = length of sample cell (cm)
The longer the pathlength the more light is absorbed. Also, the higher the concentration of compound in solution the more light is absorbed. Absorbance is proportional to pathlength and the concentration (Beer-Lambert's law)
Thus, A = a • b • c where a = absorptivity (epsilon - molar absorptivity includes pathlength and wavelength), b = pathlength (commonly 1 cm), and c = concentration (molar if molar absorptivity)
If b is 1 cm and c is in g/100ml the absorptivity is given as A1%1 cm at wavelength (lambda).


Introduction to Spectroscopy


A. Electromagnetic Radiation

Electromagnetic waves are made as an thrilling meadow and a magnetic meadow hurl made known waves of energy with the intention of overlap.
Electromagnetic waves exist in a large range of frequencies and wavelengths and can travel through all media. When they are absorbed, electromagnetic waves can yield excitement. Electromagnetic waves power an  amazing digit of things we aid each time. Radio waves enable us to transmit and receive sound ended splendid distances. X-rays consent to us think it over inside people's bodies to check pro kaput bones. Microwaves help us lukewarm up food in a hasten and transmit television signals using satellites. Even the sun itself transmits electromagnetic waves in the form of ultraviolet_radiation. 

Spectroscopy
Introduction
Spectroscopy is the aid of the captivation, emanation, or scattering of electromagnetic radiation by topic to qualitatively or quantitatively study the topic or to study corporal processes. The topic can be atoms, molecules, atomic or molecular ions, or solids. The interaction of  radiation with topic can cause redirection of the radiation and/or transitions linking the energy levels of the atoms or molecules.

Absorption: A transition from a decrease level to a privileged level with conveying of energy from the radiation meadow to an absorber, atom, molecule, or solid.

Emission: A transition from a privileged level to a decrease level with conveying of energy from the emitter to the radiation meadow. If thumbs down radiation is emitted, the transition from privileged to decrease energy levels is called nonradiative decay.

Scattering: Redirection of light due to its interaction with topic. Scattering might or might not occur with a conveying of energy, i.E., the scattered radiation might or might not be inflicted with a vaguely uncommon wavelength compared to the light thing on the sample.

Atomic Energy Levels
Introduction
The energy levels of atoms are quantized and be inflicted with definite, discrete energies. The energies are measured relation to the energy vital to remove an electron, which is called the ionization the makings of the atom. The map shows the energy levels pro the H atom. Transitions linking energy levels with the intention of occupy the captivation or emanation of light is the meadow of spectroscopy.
H atom energy levels information see this:-
1,  http://hyperphysics.phy-astr.gsu.edu/hbase/atomic/grotrian.html
2,  http://hyperphysics.phy-astr.gsu.edu/hbase/quantum/hydcol.html#c3
Molecular Energy Levels
The bonding of atoms to form molecules or solids changes the orbitals with the intention of electrons can occupy, and therefore furthermore changes the energies of the electrons. Bonded atoms furthermore can vibrate and the atmosphere will be inflicted with quantized energy states. Molecules in the chatter period or in solution can rotate which solely like atmosphere will be inflicted with definite rotational energy states.


New Molecular Spectroscopy Solutions to Improve Life Science Lab Capability and Productivity


Overview

From spectroscopic measurements of fast kinetic processes to plug-and-play versatility to robust and dependable hardware, Agilent meets your molecular spectroscopy needs. Hipp this interactive webinar, Agilent consequenceence specialists will discuss the newly released Cary 60 UV-Vis spectrometer, featuring unrivaled Xe flashlamp toolsfiber optic capabilities, productivity enhancing sampling techniques, and life science applications such as measuring micro-volume and cold (4oC) samples, which are more often than notten than not obstinate or ridiculous using usualng techniques.

With the acquisition of Varian, Agilent has greatly lengtheneded its molecular spectroscopy portfolio which nowadaysadays includes the 8453, the fastest PDA spectrometer able to purchasee an intact UV-Vis spectrum in under individualividual minute, the spankingnking Cary 60 utilizing best-in-class Xe flashlamp tools the Cary 4000 / 5000 / 6000i, the highest performing UV-Vis and UV-Vis-NIR spectrometers freeho mustttend?

UV-Vis, Molecular spectroscopy, Pharma, Biotech, Academic, Synthetic chemists, Organic chemists, biochemists, biomedical

General information Spectroscopy

In this study we performed photoelectron spectroscopy (XPS and UPS) to study the energy level alignment and the chemistry at the interface between P3HT and contact metals. The experiments were performed at the Environmental Molecular Sciences Laboratory (EMSL) at Pacific Northwest National Laboratory (PNNL), Richland, WA and the Laboratory for Surface Science & Technology at the University of Maine. Both polymer-on-metal and metal-on-polymer configurations of the polymer/metal interface were studied. In the polymer-on-metal configuration XPS and UPS measurements were conducted over bare metallic (Pt and Au) substrates. In the metal-on-polymer configuration the interface was studied by depositing Pt and Cu metals on top of the P3HT surface on monolayer by monolayer basis. XPS and UPS measurements were carried out after each deposition. The XPS results show that there is a chemical interaction between the metal (both Pt and Cu) and S from the backbone thiophene ring of P3HT chain. The UPS measurements in the metal-on-polymer configuration show the presence of negligible interfacial dipole as compared to a significant one in the case of polymer-on-metal configuration indicating that the energy level alignment is asymmetric depending upon the order of deposition of the metal and the polymer.


Publications:

K. A. Singh, P. Nachimuthu, Z. Yu, S. Thevuthasan, G. Bernhardt, R. Ladd and L. M. Porter, “Electronic and chemical nature of the interface between metals and poly(3-hexylthiophene) from ultraviolet and x-ray photoelectron spectroscopy”, (manuscript under preparation).